GSoC Report: Curvature for MDA Universes
02 Sep 2021The main goal of my GSoC project was to develop a tool to calculate membrane curvature from MD simulations using MDAnalysis. We aimed to have the following features in the membrane curvature analysis tool:
- Surfaces derived from an
AtomGroupof reference. - Calculation of mean and Gaussian curvature.
- Multiframe and averaged-over-frames analysis.
- Plug-and-play with visualization libraries to obtain 2D curvature profiles.
- Data visualization made easy.
Why Membrane Curvature?
In the wide range of tools that are available to analyze Molecular Dynamics (MD) simulations, user-friendly, actively-maintained, and well-documented tools to calculate membrane curvature are still difficult to find. I was motivated to share a tool to calculate membrane curvature that I initially developed as part of my PhD at the Biocomputing Group. Membrane curvature is a phenomenon that can be investigated via MD simulations, and I had an interest to share this tool with the wider MD community.
Contributions
Keeping in mind the goals and motivations behind my GSoC project, I would like to hightlight three areas of contributions that were key to the MembraneCurvature MDAnalysis tool: Core functions, AnalysisBase, and Documentation.
Core functions (#9, #34, #40, #44)
The initial version of the code contained functions to map elements from
the AtomGroup of reference into a grid of dimensions defined by the simulation
box. The initial version also included the functions to calculate mean and Gaussian curvature.
After refactoring, the core functions of MembraneCurvature were cleaned
and tuned up. In summary, our core functions can be split into two groups:
-
Surface :
derive_surface(),get_z_surface(),normalize_grid(). -
Curvature :
mean_curvature(),gaussian_curvature().
These functions are our bricks to build the MembraneCurvature AnalysisBase.
Analysis Base (#43, #48)
The analysis in MembraneCurvature used the MDAnalysis AnalysisBase building block, from where we obtained the basic structure to run multilframe analysis.
In the MembraneCurvature subclass of AnalysisBase,
we define the initial arrays for surface, mean, and Gaussian curvature in the
_prepare() method. In _single_frame(), AnalysisBase runs the
membrane curvature analysis in every frame, and populates the arrays previously
defined in _prepare(). In _conclude, we compute the average over frames for
the surface and curvature arrays (#43).
The derived surface and calculated arrays of mean and Gaussian curvature values
are stored in the results attribute. This makes AnalysisBase the most
fundamental part of the MembraneCurvature analysis, allowing us to perform
multiframe and average-over-frame curvature analysis.
We also added coordinate wrapping
to our Analysis base, which enables users to run MembraneCurvature with all
atoms in the primary unit cell (#48). Having an option to wrap coordinates is
particularly useful when we want to calculate curvature with elements in the
AtomGroup that may fall outside the boundaries of the grid.
With #48, we also achieved a significant milestone: reaching 100% code coverage in MembraneCurvature! 100% coverage means that every line of code included was executed by pytest, the test suite used by MDAnalysis, to check that the code works as it should.
Documentation (#57, #62, #64, #69)
One of the strongest motivations to contribute an MDAnalysis curvature tool was to provide a well-documented package to analyze membrane curvature from MD simulations.
The membrane curvature tool includes solid documentation that can be found in the following pages:
- API documentation
- Algorithm, Usage and Visualization pages.
- Tutorials.
We included two different tutorials: One where we use Membrane Curvature to derive surfaces and calculate curvature of a membrane-only system. A second tutorial to calculate curvature in a membrane-protein system is currently under development (#69).
How can I use it?
Membrane-curvature uses MDAnalysis under the hood. We can install
Membrane-curvature via pip:
pip install membrane-curvature
Here you can find more installation instructions.
Running MembraneCurvature
MembraneCurvature was designed to be user friendly. No counterintuitive commands, and no long lines of code. With MembraneCurvature you can calculate curvature in just a few lines! The snippet below illustrates how easy it gets to extract mean and Gaussian curvature from MD simulations using MembraneCurvature:
import MDAnalysis as mda
from membrane_curvature.base import MembraneCurvature
from membrane_curvature.tests.datafiles import (MEMB_GRO,
                                                MEMB_XTC)

u = mda.Universe(MEMB_GRO, MEMB_XTC)

mc_upper = MembraneCurvature(u,
                             select="resid 103-1023 and name PO4",
                             n_x_bins=12,
                             n_y_bins=12).run()

mc_lower = MembraneCurvature(u,
                             select='resid 1024-2046 and name PO4',
                             n_x_bins=12,
                             n_y_bins=12).run()
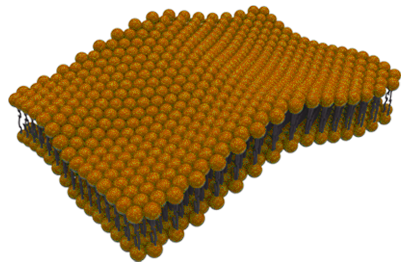
In the example above, we use two files included in the MembraneCurvature tests:
MEMB_GRO and XTC_GRO, which comprises a membrane of lipid composition
POPC:POPE:CHOL, in a
5:4:1 ratio:
We use the selection "resid 103-1023 and name PO4" as an
AtomGroup of reference to derive the surface associated to the upper leaflet.
Similarly, we derive the surface from the lower leaflet with the AtomGroup
defined by the selection "resid 1024-2046 and name PO4" . In this example,
PO4 is the name of the phospholipid head groups.
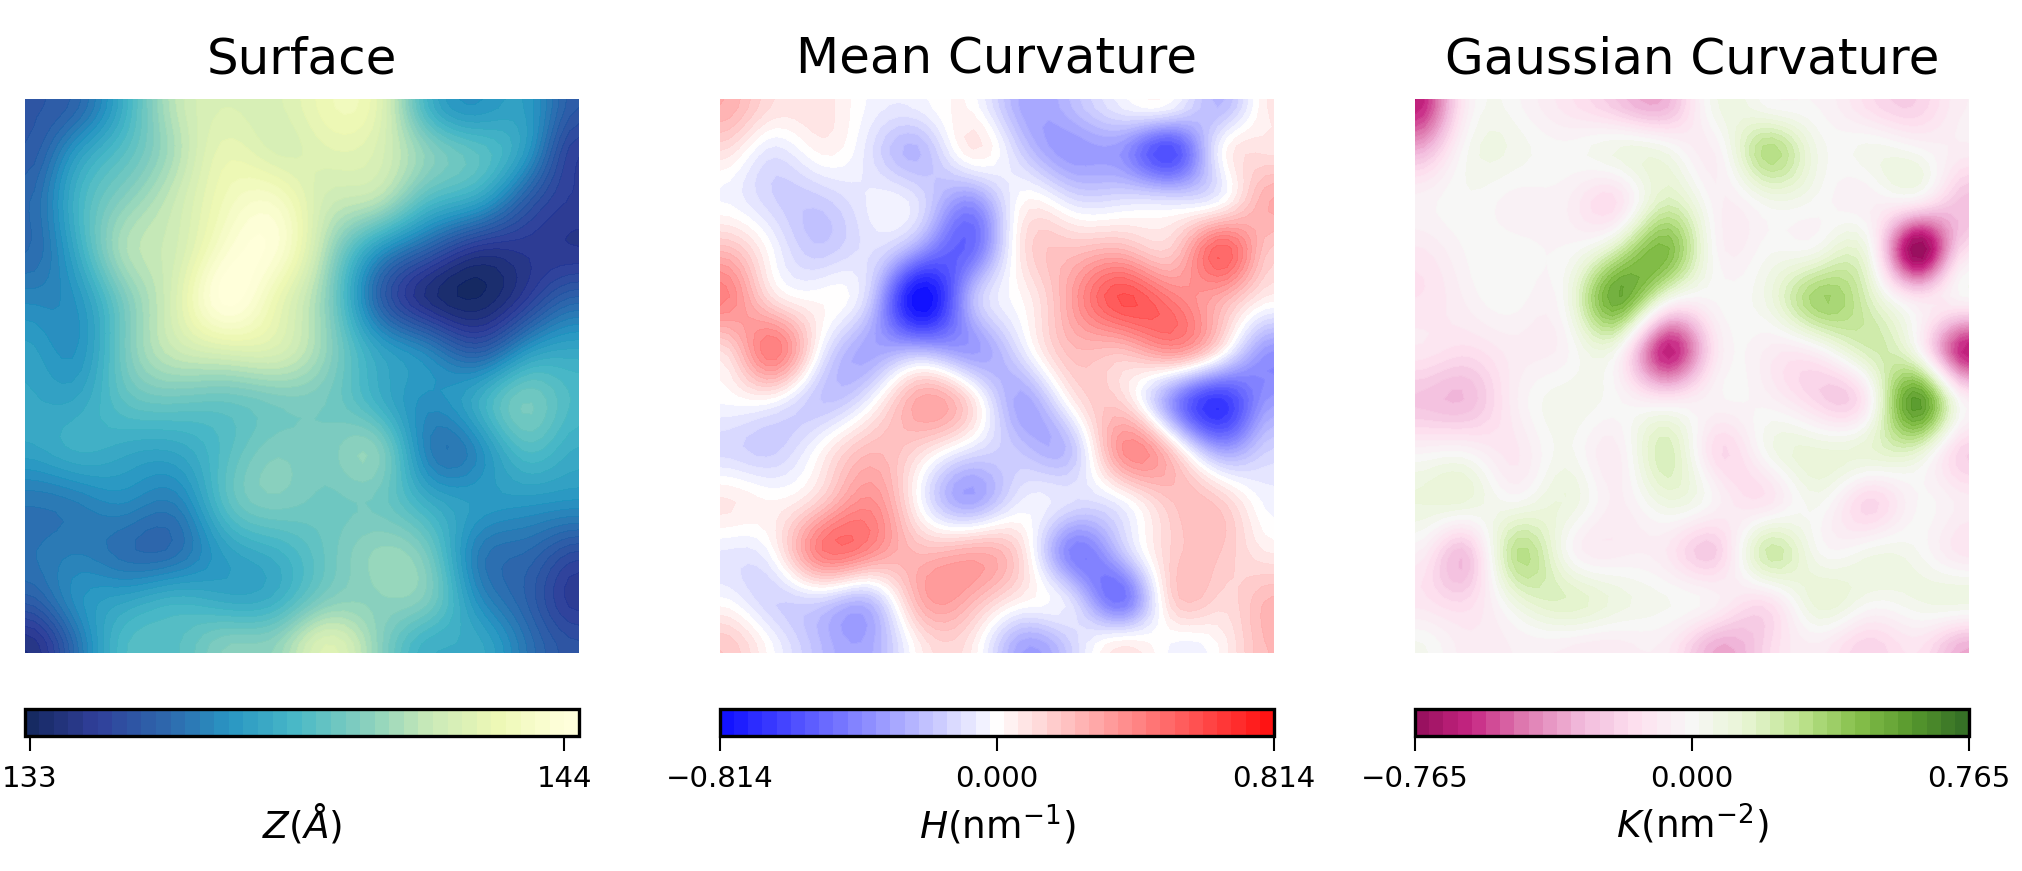
After running MembraneCurvature, the calculated values of the derived surface
(H), and Gaussian curvature (K) are stored in the _results() attribute. We
can easily extract the average results with:
# surface
surf_upper = mc_upper.results.average_z_surface
surf_lower = mc_lower.results.average_z_surface

# mean curvature
mean_upper = mc_upper.results.average_mean
mean_lower = mc_lower.results.average_mean

# Gaussian curvature
gauss_upper = mc_upper.results.average_gaussian
gauss_lower = mc_lower.results.average_gaussian
Plots
To visualize the results from MembraneCurvature.run(), we can use contourf or imshow from Matplotlib.
For example, here is the plot of the averaged results for the upper leaflet using contours:
In biological membranes of higher complexity, lipid composition between leaflets is commonly assymetric. With the results obtained from MembraneCurvature, direct comparison between leaflets can be easily performed. The following snippet generates a side-by-side plot of the mean curvature results for each leaflet with its respective color bar:
import matplotlib.pyplot as plt
from scipy import ndimage
import numpy as np

results = [mean_lower, mean_upper]
leaflets = ["Lower", "Upper"]

fig, [ax1, ax2] = plt.subplots(ncols=2, figsize=(4,3.5))
max_ = max([np.max(abs(h)) for h in results])

for ax, rs, lf in zip((ax1, ax2), results, leaflets):
    rs = ndimage.zoom(rs, 4, mode='wrap', order=1)
    levs = np.linspace(-max_, max_, 40)
    im = ax.contourf(rs, cmap='bwr',
                     origin='lower', levels=levs,
                     vmin=-max_, vmax=max_)

    ax.set_aspect('equal')
    ax.set_title('{} Leaflet'.format(lf), fontsize=6)
    ax.axis('off')

cbar = plt.colorbar(im, ticks=[-max_, 0, max_],
                    orientation='vertical',
                    ax=[ax1, ax2], shrink=0.4,
                    aspect=10, pad=0.05)
cbar.ax.tick_params(labelsize=4, width=0.5)
cbar.set_label('H (nm$^{-1}$)', fontsize=6, labelpad=2)
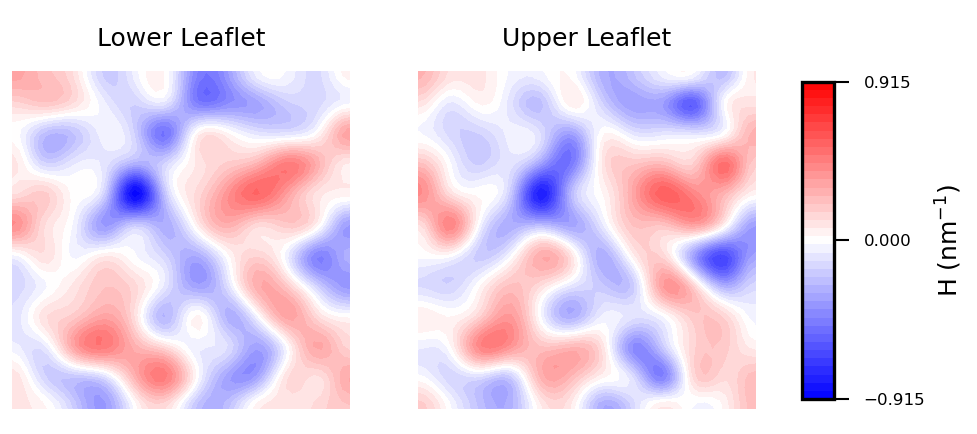
Mean curvature plots provide information about the “inverted shape” of the surface, which in this example is derived from phospholipids headgroups in each leaflet. Positive mean curvature indicates valleys (red coloured), negative mean curvature is associated with peaks (blue coloured). Regions where H=0 indicates a flat region (white coloured). In the example considered here, the contour plot of mean curvature shows:
-
Coupling between leaflets. Regions of positive curvature (red coloured) in the lower leaflet match those in the upper leaflet. The same is observed for regions of negative curvature (blue coloured).
-
A central region of negative curvature. For both upper and lower leaflets, there is a central region of negative mean curvature (blue coloured) along the y axis, while regions of positive curvature (red coloured) are localized in the bulk of the membrane, in particular bottom left and upper right regions.
In progress
Currently, we are working on implementing interpolation as an option for the user #52.
In some situations, when selecting a very high number of bins in the grid, or when having regions of the grid with low sampling we may find regions of undefined values. For example, think of a membrane-protein system, where the bins occupied by the protein won’t be populated by lipids, and therefore, will have a region of undefined values in the grid. Such undefined values spread in the array during the calculation of curvature, which may result in meaningless output.
By adding an optional interpolation, we will be able to patch up undefined values in bins inside the embedded element (i.e. protein). With this improvement, calculation of membrane curvature won’t be hamstrung by the presence of undefined values in the grid.
What’s next?
There is always room for improvement, and MembraneCurvature is not an exception. One of the main limitations of the current version of MembraneCurvature is the inability to calculate curvature in systems like vesicles, capsids, or micelles. This would definitely be a nice improvement for a future release of MembraneCurvature!
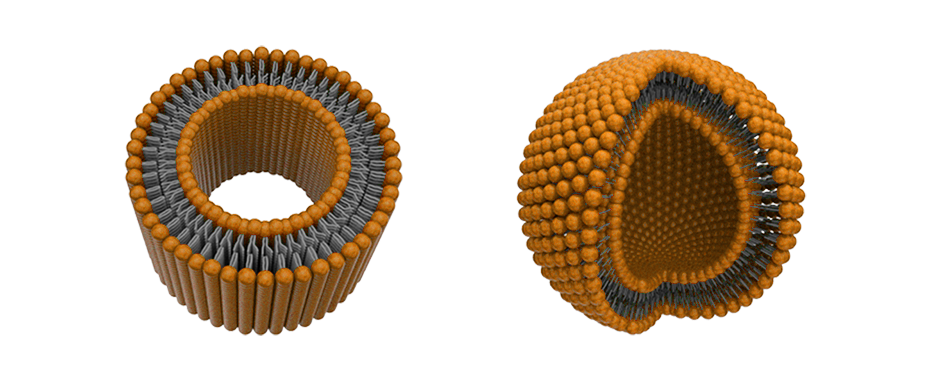
We acknowledge that scientific research would benefit from a tool to calculate membrane curvature in these types of systems, so we are considering possible approaches to include more topologies in MembraneCurvature!
Summary
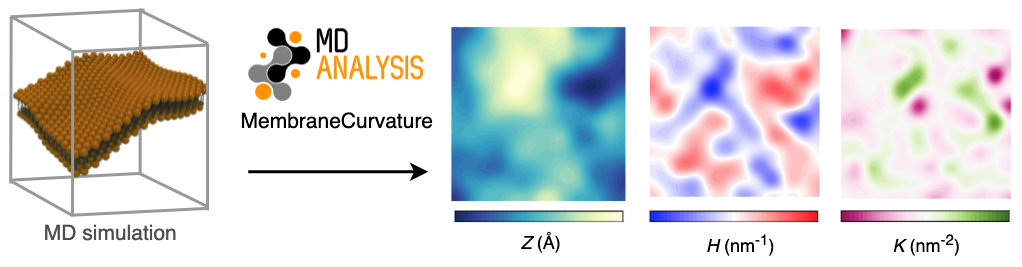
MembraneCurvature is a well-documented and easy-to-use tool to derive 2D maps of mean and Gaussian curvature from Molecular Dynamics (MD) simulations. Since it uses the MDAnalysis AnalysisBase building block, MembraneCurvature enable users to perform multiframe and average-over-frames curvature analyses.
From MD simulations to 2D curvature profiles in only a few lines of code!
Acknowledgments
Participating in GSoC with MDAnalysis has been a unique experience. I had the opportunity to learn best practices in software development mentored by a group of incredibly talented people:
- @lilyminium (Lily),
- @IAlibay (Irfan),
- @fiona-naughton (Fiona), and
- @orbeckst (Oliver).
I also would like to thank @richardjgowers (Richard) and @tylerjereddy (Tyler)
from the MDA community, who participated in our discussions and provided
valuable insights.
Thanks for all your valuable lessons.
MembraneCurvature has launched! 🚀
— @ojeda-e